
Average Wallet Value of Web3 Customers
Knowing the average wallet value of your Web3 customers could be useful for several reasons:
- It helps gauge spending power and potential revenue. If customers have a higher average wallet value, they may be willing and able to spend more on your products/services. This could indicate greater revenue potential.
- It informs targeting and marketing. If you know the average wallet value, you can target marketing to the right customer segments and tailor offerings to different wallet value ranges. For example, you might offer premium packages/features for those with higher wallet values.
- It provides insight into user needs. A higher average wallet value could indicate users have more complex needs or are interested in more advanced features. Tracking this metric over time could reveal evolving needs and interests in the Web3 space.
Understanding the characteristics of your customer base, including average wallet value, can help web3 companies better serve their users and grow their businesses. Additional data on factors like user volume, transaction rates, and more can paint a fuller picture of a company's audience and opportunities.
How to Plot Your Users' Balance Over Time with Multibase: A Step-by-Step Guide
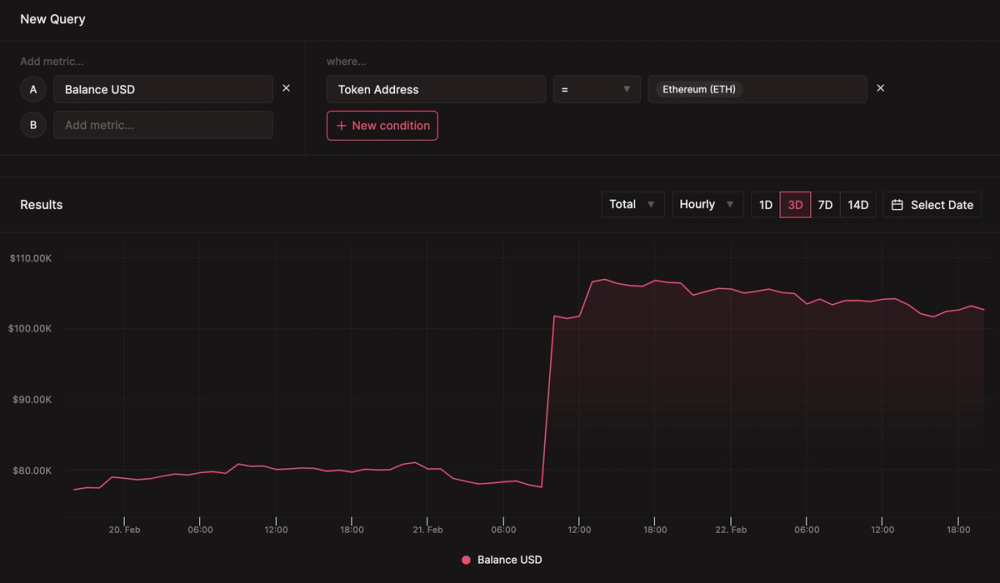
At the moment, I will demonstrate the process of plotting your users' balance over time. To get started, register a Multibase account and connect all your wallets. Next, create a new query and choose a time-based query. On the query page, select the metric you want to track: Balance Native or Balance USD. The only distinction between the two is that Balance USD converts the token balance into USD denominations. Then, choose the where property, which will be a token address of your choice that you want to plot over time. Once you've completed these steps, the chart will be generated, and you can view your users' balances over time. You can modify the date range, granularity, and switch between seeing the total balance and average balance after the chart is generated. Additionally, you can view a table of this data by scrolling down, and you have the option to export it to a CSV file.
In this post: